The Simple Numbers 100: Revenue Is Up. Profit Is Not
The December results are in and it continues to be a mixed bag for privately owned and operated businesses.
By Brandon Gray
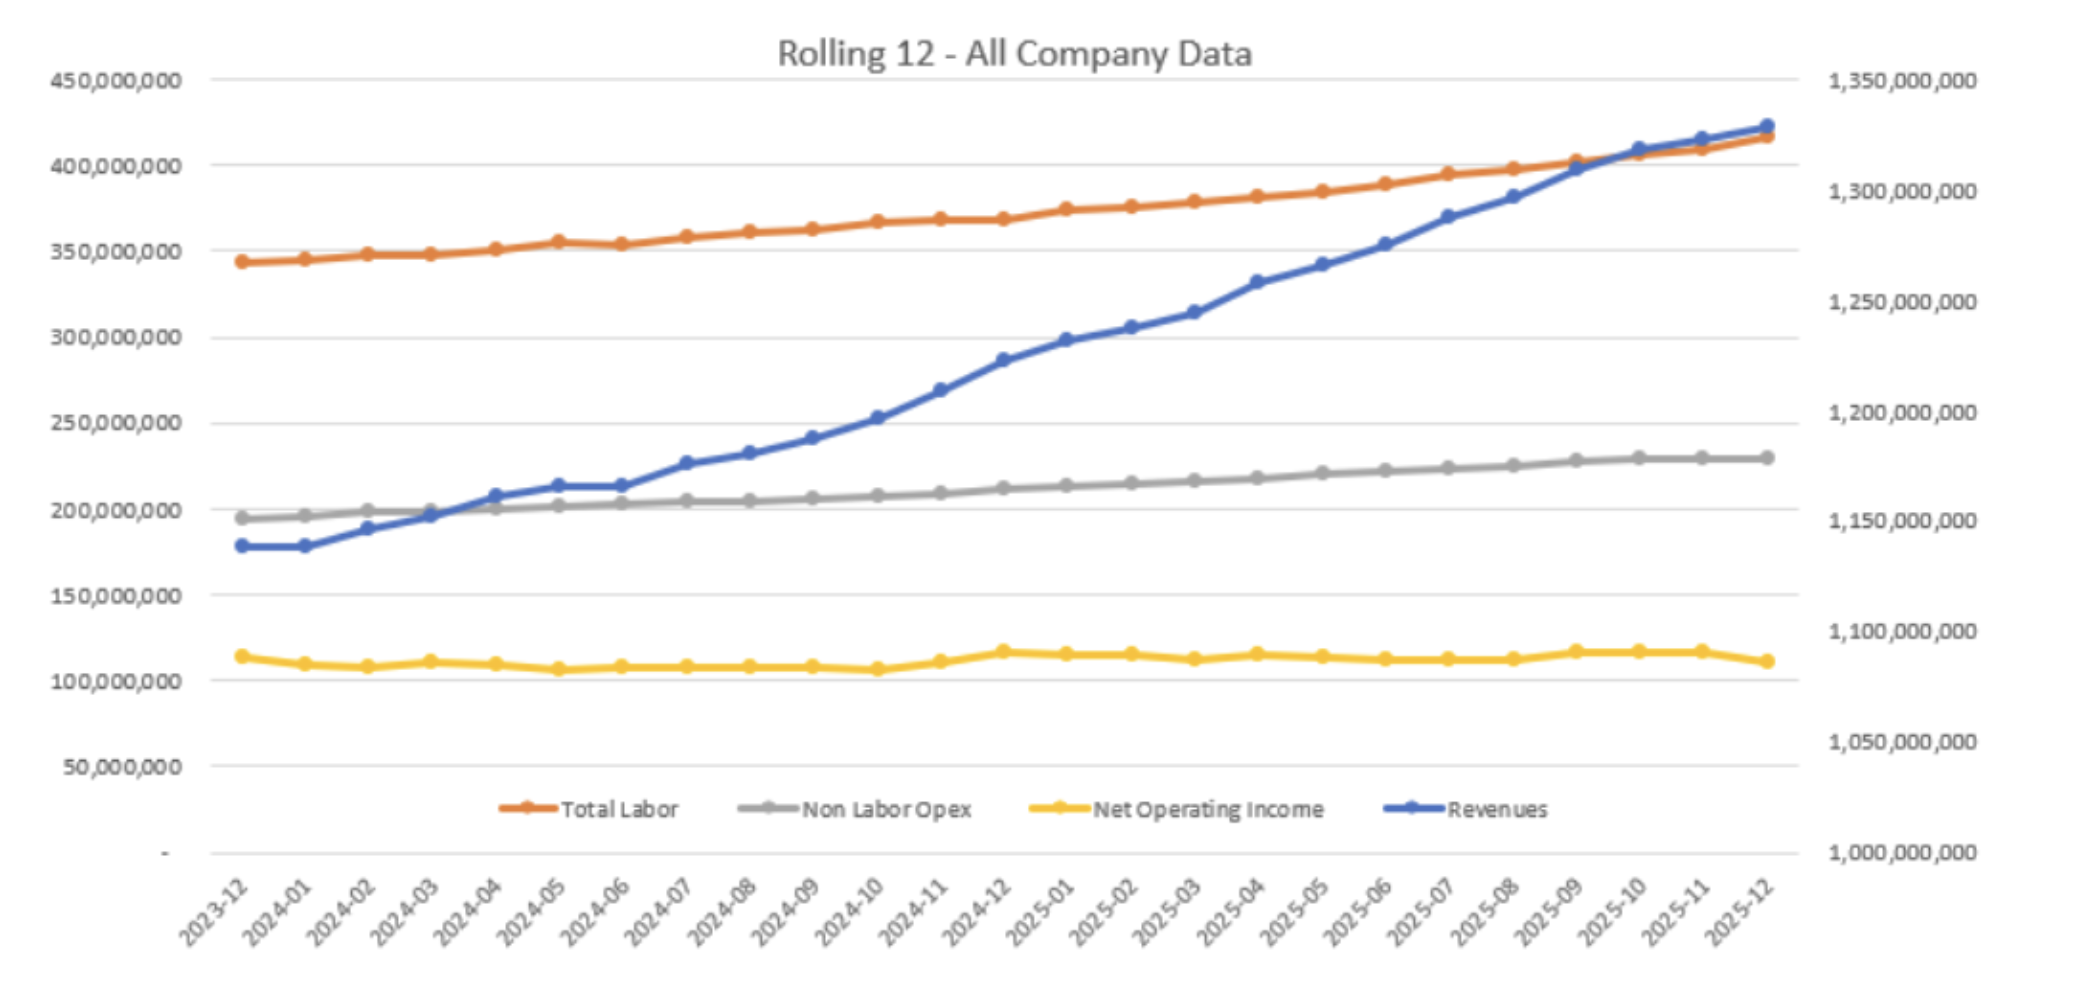
As you can see in the graph above, the good news is that total annual revenue for the Simple Numbers 100, shown on the left axis, has been rising. Unfortunately, the increased revenue has not been generating increased profitability, or net income, as shown on the right axis (along with labor and non-labor operating expenses). It is our belief that a majority of the revenue growth is from price increases and not from activity increases. As we discussed last month, many companies are struggling to control their labor costs and operating expenses. We have reached the point where, for most companies, pricing can no longer keep up with inflation.
Throughout 2025, profit was holding steady and increasing at times—until December. This was somewhat expected, given that we track performance based on a rolling 12-month basis. That means December of 2025 is replacing December of 2024 in the model calculations, and December of 2024 was a strong month. The election had ended, interest rate decline had begun, and tariff policy remained stable. December 2025 rolled into the model with $5 million less profit across the 100 companies than December 2024 showed.
There is a real divide between companies that are growing (about 60 percent) and those that are not (nearly 40 percent). One notable difference is their approach to marketing. Companies in the SN 100 whose revenue is growing have increased their marketing spend by 19 percent. Companies with declining revenue have reduced their marketing expenditures by 7 percent. This area bears watching, especially given that the game has changed in recent years. The rise of AI along with the ever-evolving algorithms have created chaos and confusion. As we speak with marketing experts, it’s clear that most companies are having a harder time figuring out how to message their value and competitive advantage.
As for the overall health of the companies in the model, it has remained stable. We encourage companies to keep two months of operating expenses and direct labor expenses on hand, along with a line of credit with a zero balance. We refer to this as core or buffer capital. As of December, the average SN 100 company was at 1.84 months. That said, the trend has been declining, down from 2.11 months in December 2024.
At the same time, the average time it takes SN 100 companies to take payment—days sales outstanding–has remained level over the past year at just under 30 days. This is a positive sign, as there appears to be no slow down in customer ability to pay. That said, as profitability has declined, so has return on investment. Total ROI for the model has declined from 51 percent in December 2024 to 44 percent in December 225. That, of course, is still a phenomenal return when compared to the Dow Jones return of 13 percent in 2025.
Brandon Gray is a partner with CRI Simple Numbers.